As we are deemed an essential service in supporting the banking and insurance sectors, we are still progressing with the completion of appraisals and risk management reporting. We have had to alter our inspection protocols to ensure the safety of our clients and staff, inclusive of having all of our appraisal/risk management staff working remotely. One of the questions that our clients have been asking is our thoughts on values post COVID.
There are so many factors in that single question, here are some of the factors we will be examining post COVID:
• How long will “cheap” capital be available, if the recovery period is accelerated, cost of funds may go up;
• What types of government stimulus programs will there be, which, in turn, will affect construction activity and potentially impact the cost of construction;
• Changes in demand, will remote working and the prolonged need for physical distancing change the demand for real estate which would impact market values and potentially insurable values;
• Will we continue to focus on climate change initiatives that mean more “Green” buildings, will the potential changes in demand and the drive for innovation make these buildings more affordable;
• Will oil prices and demand continue to sag, which in turn can affect the demand and values of “yellow iron” and other machinery?
In looking at these factors, we will look to examine other Black Swan events. Since 1997, we can look at 9 such events (1):
1997 – Asian Financial Crisis
2000 – The Dot-Com Crash
2001 – 9/11
2008 – Global Financial Meltdown
2009 – European Sovereign Debt Crisis
2011 – Fukushima Nuclear Disaster
2014 – Crude Oil Crisis
2015 – Black Monday China
2016 – Brexit
The current economic malaise is due to a non-economic event such as 9/11, the 2008 Global Financial Meltdown was due an economic event (bad credit, high debt loads). However, events like the 2008 Global Financial Meltdown provide us context for a recovery period. Running up to 2008 we saw a “complacency that emanated from years of stable growth, low inflation & high employment rates in the US which brought financiers to lend recklessly”. (1)
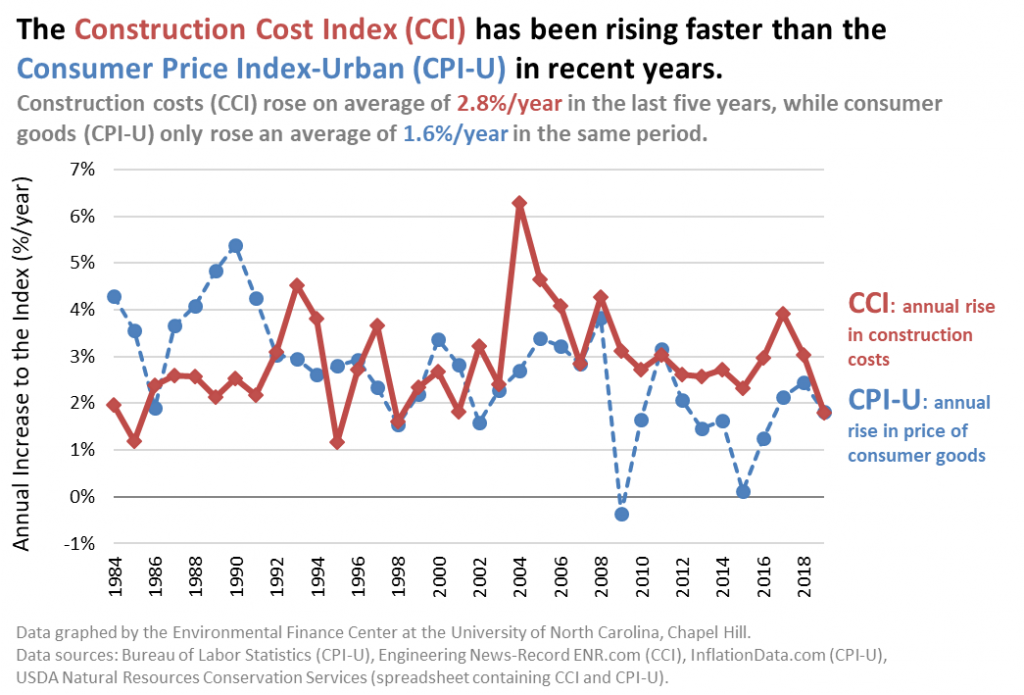
In 2020, we had a similar scenario, stability of growth, lower inflation and high rates of employment in the United States. We were seeing the impact in our appraisals as best illustrated by the following graphs:
Relative to insurable cost values on a generic basis:
Relative to market values for commercial real estate on a generic basis:
Green Street Commercial Property Price Index
Indexed to 100 in August 2007
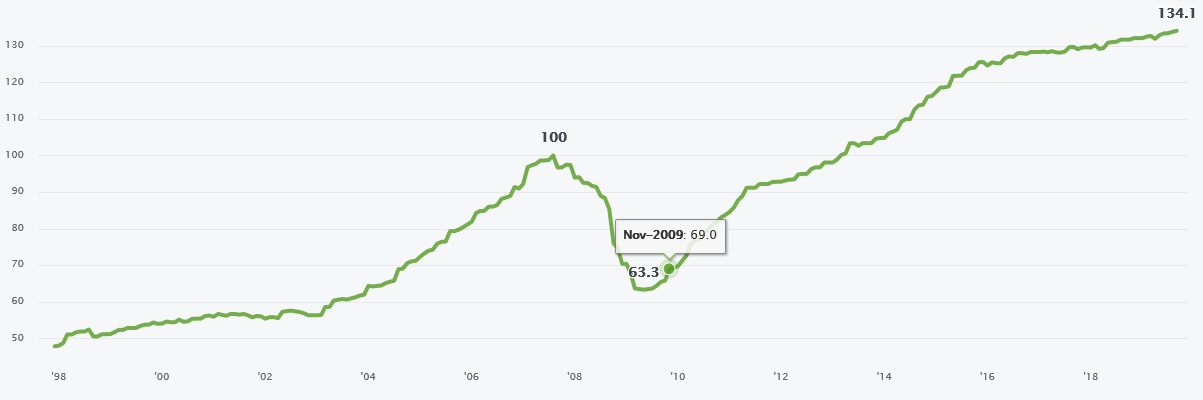
All Property CPPI weights: retail (20%), office (17.5%), apartment (15%), health care (15%), industrial (10%), lodging (7.5%), net lease (5%), self storage (5%), manufactured home park (2.5%), and student housing (2.5%). Retail is mall (50%) and strip retail (50%). Core Sector CPPI weights: apartment (25%), industrial (25%), office (25%), and retail (25%). (2)
So what does this all mean for impact on values? It is important to note the distinction between insurable cost values and market values (we have posted to our web-site a previous blog on the distinctions between these two premies of value).
Prior to COVID 19 and the oil price crisis, we would look at some predictive models (as below from Science Direct) that provided trends for construction costs (3):
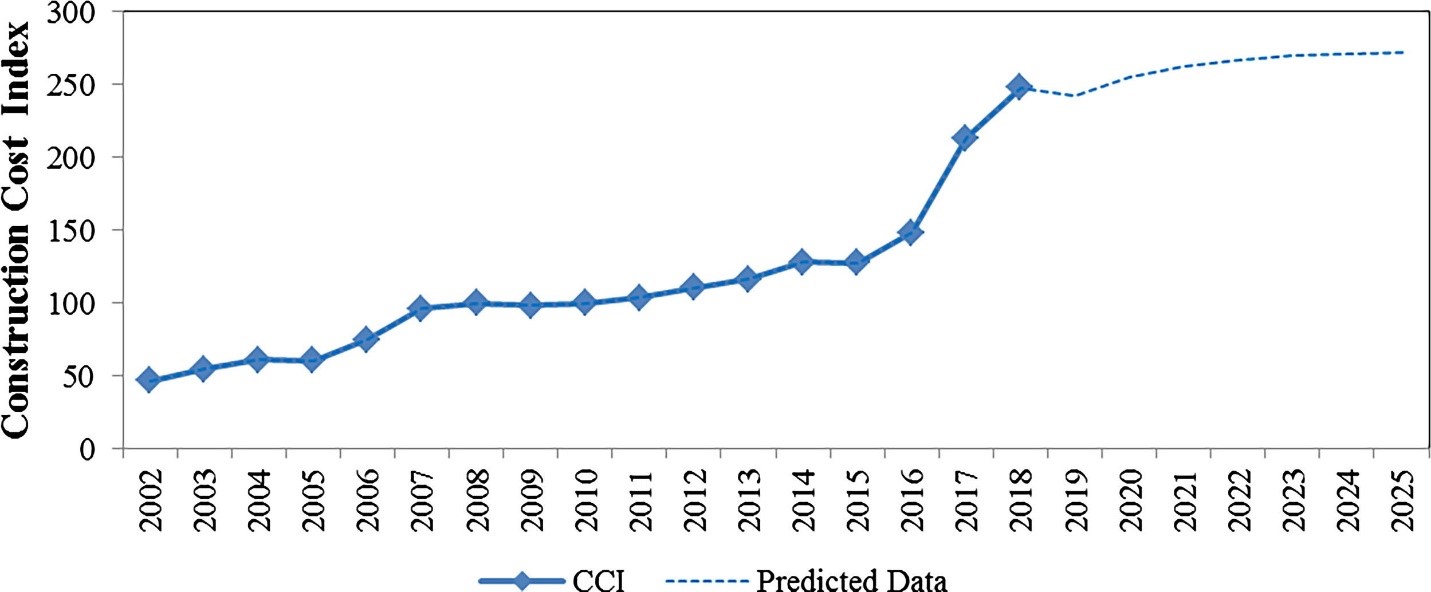
However given the unprecedented nature of the current Black Swan event no one can reasonably predict what the new trends will be, perhaps we will see no change, an increase or sharp drop for both construction costs and market values. However, government intervention may stave off sharp drops or at least shorten the effects of the Black Swan event. Again it is important to note the distinction between insurable cost values and market values, the trends for both are somewhat correlated over time (not perfectly), however in the current environment they could de-couple as governments look to financially support infrastructure projects as economy starters. Furthermore, we could see future insurable cost values and market value trends differ for component type, property type and regions.
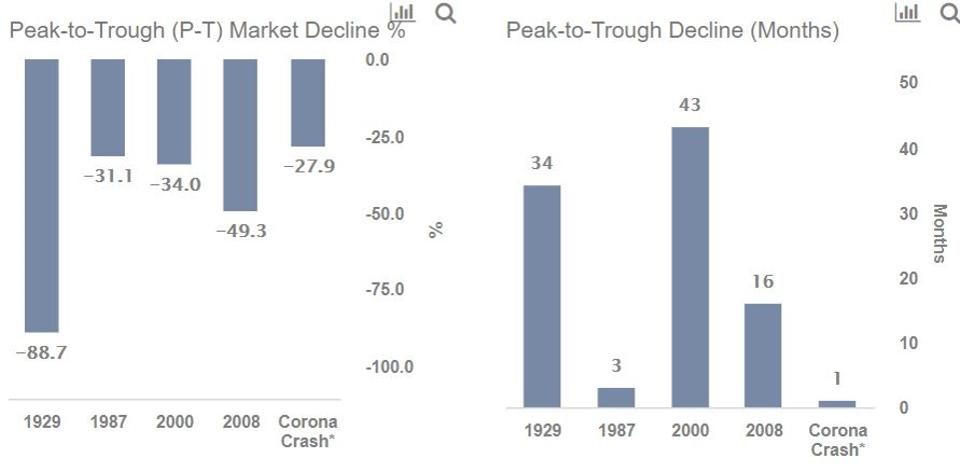
Ultimately, we know we are in for periods of volatility (and that the volatility maybe based on geography), particularly until we have a vaccine for COVID 19. Accordingly, the only impact we can predict with some certainty is that we are going to have some volatility, and that we will need to build in some contingencies for this event and for future Black Swan events, time tells us they will occur and this latest event takes us to the extreme in terms of magnitude of impact. As below, some timelines that demonstrate potential impact due to COVID 19.
Timelines of Past Crises in the Stock Markets (4):
| Crisis | Pre-Crisis Peak | Market Bottom |
|---|---|---|
| Great Depression | August 1929 | June 1932 |
| Black Monday | August 1987 | November 1987 |
| 2000’s Recession | December 1999 | September 2002 |
| Great Recession | October 2007 | February 2009 |
REFERENCES:
Faisal Khan (January 18, 2019). 9 Black Swan Events that changed the Financial World. Retrieved from https://www.datadriveninvestor.com/2019/01/18/9-black-swan-events-that-changed-the-financial-world/
Commercial Property Index. Retrieved from https://www.greenstreetadvisors.com/insights/CPPI.
Construction cost index prediction using neural networks. Retrieved from https://www.sciencedirect.com/science/article/pii/S1110016819300316#f0025
Trefis Team (March 13, 2020). Market Crashes Compared:-28% Coronavirus Crash Vs. 3 Historic Market Crashes. Retrieved from https://www.forbes.com/sites/greatspeculations/2020/03/13/market-crashes-compared28-coronavirus-crash-vs-4-historic-market-crashes/#5112cdd14ee8