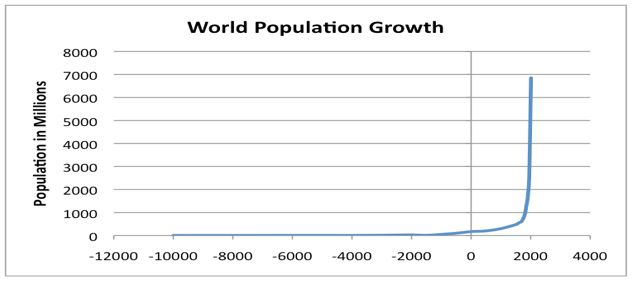
Agricultural land value trends are on the rise. As the graph below illustrates, the world population has increased dramatically since the Industrial Revolution, circa 1800. (1)
Will Farmland Price Values Increase Over Time?
The world population growth coincides with access to energy, which led to innovation in creating and managing food supply. As a full service appraisal firm with offices across North America and completing engagements worldwide, we are often called to assist firms with the valuation of facilities involved in food processing. As many of our clients have grown their facility footprint, we have seen dramatic jumps in the value of agricultural land that provide the inputs for their processing. Unlike new facilities, agricultural land cannot be created. Combine the population growth with the effects of climate change, and it is easy to see the trend for agricultural land values across the globe will continue to rise.
Agriculture Land Price Trends in Europe
Europe continues to lead the pace of growth in agricultural land values.
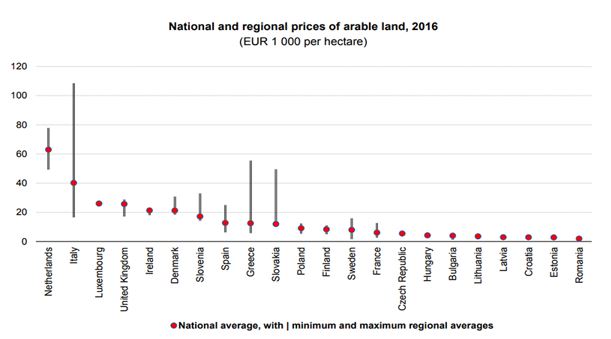
In 2016, the exchange rate for Euros to US Dollars was 1 to 1.24; accordingly 63,000 Euros (the benchmark price per hectare in the Netherlands) converted to $78,031 US Dollars. Converting hectares to acres at 1 to 2.5 meant that the land agricultural land value in the Netherlands was $31,200 US Dollars per acre. (2)
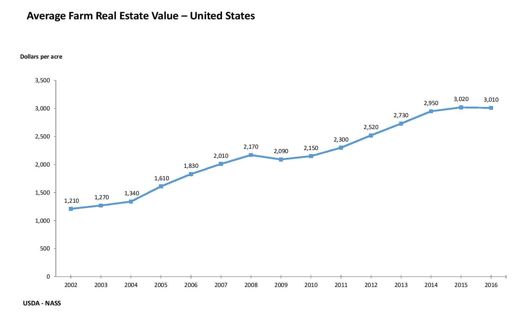
Agriculture Land Price Trends in North America
In the United States and Canada, we see the escalation in agricultural land values as well. For 2017, the United States Department of Agriculture shows the benchmark value across the country at $3,080 per acre, up from $3,010 per acre in 2016. (3)
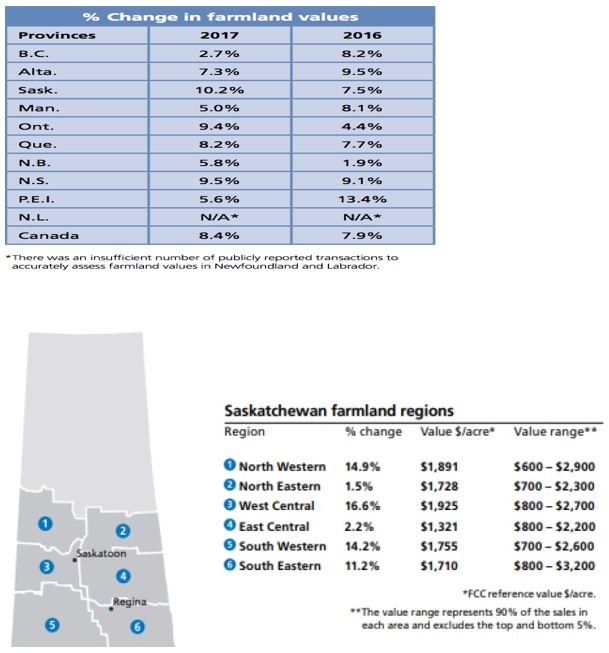
In Canada, percentage growth rates for agricultural land continues to grow, taking the province of Saskatchewan as an example, you see the benchmark prices per acre trending up-wards. (4)
Measuring The Risk of Farmland Ownership
Given the trend of rising agricultural values, it is interesting to measure the risk of land ownership. This graph illustrates the security of owning land in various countries as developed by Savills Research. They leveraged various reports and data sources to the lay the foundations of the matrix. Savills Research from 2002 to 2016 highlighted the strong and steady rise in the value of farmland globally. (5)
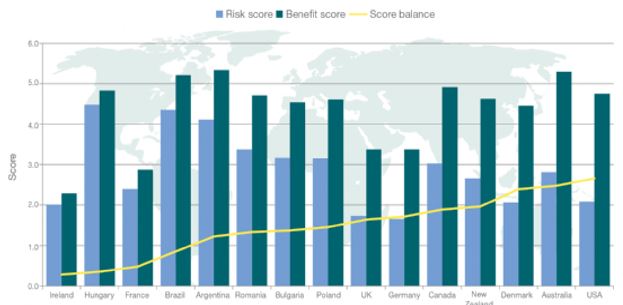
Agricultural Land Price Values Will Continue To Rise
We assert that world agricultural land values will continue to rise in the next 3 to 5 years, in particular in those countries where an adequate risk/benefit score can be achieved, such as shown by the above graph.
CONTACT SUNCORP NOW
REFERENCES:
Gail Tverberg (2012). How Energy Shapes the Economy. The Energy Collective Group
Sara Schafer (2018). Which European Countries Have the Most Expensive Farmland?
USDA (2017). Land Values 2017 Summary
Farm Credit Canada (2017). 2017 FCC Farmland Values Report