Agricultural land value trends continue to rise.
We last provided a blog on agricultural land values in March 2019, and are pleased to provide an up-date to that blog. As the graph below illustrates the world population has increased dramatically since the Industrial Revolution, circa 1800. (1)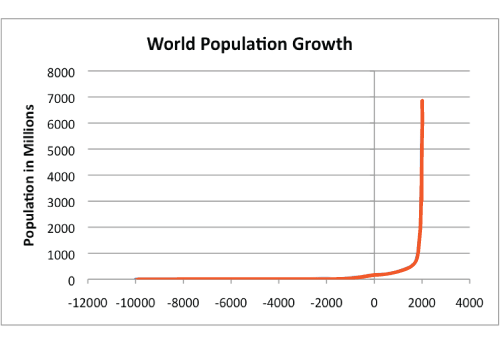 The world population growth coincides with access to energy, which led to innovation in creating and managing food supply.
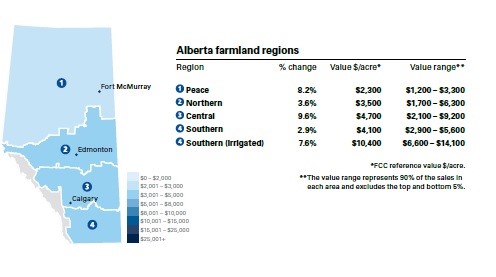
As a full service appraisal firm with offices across North America and completing engagements worldwide, we are often called to assist firms with the valuation of facilities involved in food processing. As many of our clients have grown their facility footprint, we have seen dramatic jumps in the value of agricultural land that provide the inputs for their processing. As the graph below depicts, agricultural land is at premium in certain regions. (2)
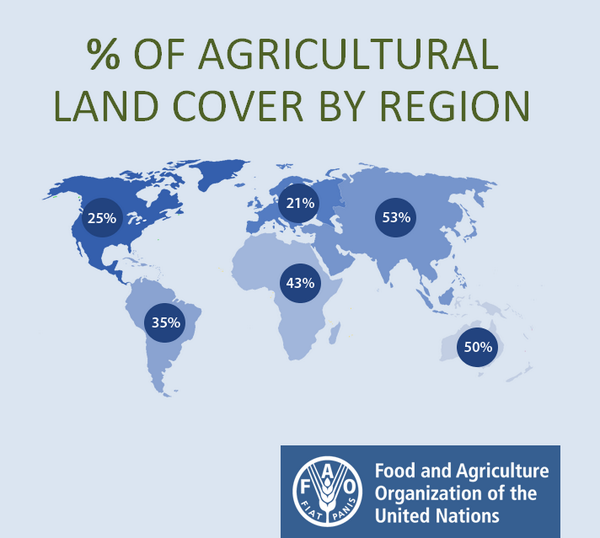
Combine the population growth with the effects of climate change and it is easy to see the trend for agricultural land values across the globe has risen and we assert will continue to rise.
Europe continues to lead the pace of growth in agricultural land values.
The Netherlands is the country with the highest agricultural land prices in Europe, with an average price of €69,632/ha in 2019. Prices in Eastern European countries are lower: €3,395/ha in Croatia, €3,361/ha in Estonia, €3,922/ha in Latvia. Conversely, land is expensive in Italy, at an average of €34 156/ha, and in Ireland, at €28 068/ha. (3)
In 2019, the exchange rate for Euros to US Dollars was 1 to 1.12; accordingly, 70,000 Euros (the benchmark price per hectare in the Netherlands) converted to $78,400 US Dollars. Converting hectares to acres at 1 to 2.5 meant that the land agricultural land value in the Netherlands was $31,360 US Dollars per acre.
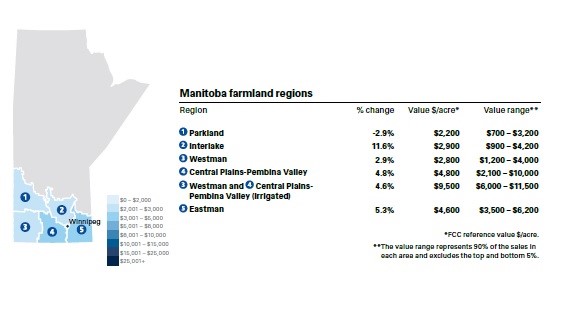
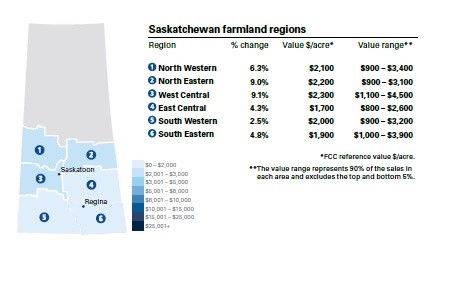
In the United States and Canada, we see the escalation in agricultural land values as well. For 2021, the United States Department of Agriculture shows the benchmark value across the country at $3,380 per acre, up from $3,160 per acre in 2020. (4)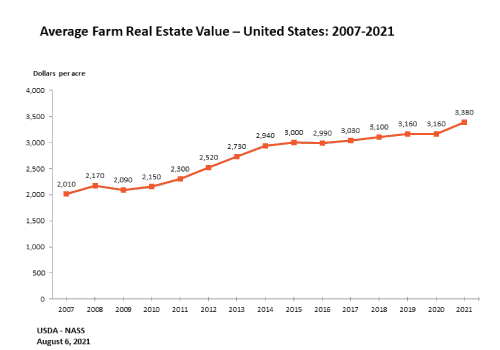 In Canada, percentage growth rates for agricultural land continues to grow. The Prairie Provinces have exhibited rise in benchmark values for the last several years. (5)
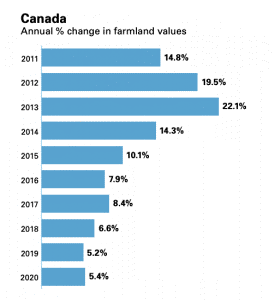
Given the trend of rising agricultural values, it is interesting to measure the risk of land ownership; this graph illustrates the security of owning land in various countries as developed by Savills Research. They leveraged various reports and data sources to the lay the foundations of the matrix. Savills Research from 2002 to 2016 highlighted the strong and steady rise in the value of farmland globally. (6)
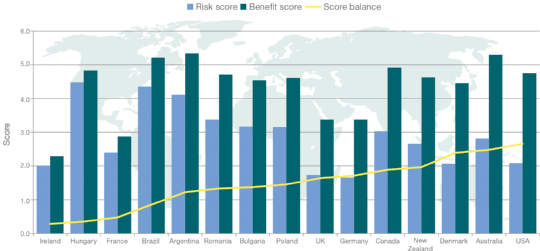
We assert that world agricultural land values will continue to rise in the next 3 to 5 years, in particular in those countries where an adequate risk/benefit score can be achieved, such as shown by the above graph.
REFERENCES:

Recently, we have been conferring with many clients and their accounting counsel on the potential for economic impairment and subsequent potential for write-downs as they wrestle with the day-to-day impacts of COVID-19. This is relevant to financial statements for the periods ending after December 31, 2019.
The implications for financial statements include not only the measurement of assets and liabilities but also disclosure and possibly an entity’s ability to continue as a going concern. The implications, including the indirect effects from lower economic activity, should be considered by all entities, not just those in the territories most significantly affected. (1)
Here are some bullet points to consider:
- Asset write-downs and impairments are a big focus. Impairments really put pressure on companies’ balance sheets. They occur in an environment in which the company is distressed, assets are being written down, and at a time when companies really need capital to sustain their operations. (2)
- Whether you are operating under International Financial Reporting Standards (IFRS) or Generally Accepted Accounting Principles (GAAP), the relevant accounting associations are providing guidance that businesses should examine.
 The Chartered Professional Accountants Canada has provided a valuable alert relative to Accounting Standards for Private Enterprises (ASPE), see https://www.iasplus.com/en-ca/publications/cpa-canada/assessing-potential-covid-19-impacts-on-financial-statements-questions-to-ask-under-aspe/at_download/file/02449-RG-ASPE-Alert-Assessing-COVID-19-Impact-Questions-June-2020.pdf.
The ASPE bulletin provides guidance relative to Property, Plant and Equipment.
Impairment of Assets Other than Financial Instruments
The financial performance of entities may be significantly affected by COVID-19 and related government measures. This may raise impairment concerns for various assets held by an entity including property, plant and equipment, intangible assets, goodwill, investments in other entities, inventories and other assets.
These assets are tested for recoverability whenever events or changes in circumstances indicate that their carrying amount may not be recoverable. COVID-19 may raise questions, such as:
• Are some items of property, plant or equipment no longer in use due to COVID-19?
• Have certain operations of the business closed down, either temporarily or permanently?
• Is the useful life of any asset likely to be shortened as a result of COVID-19?
The above are examples of indicators of impairment and are not meant to be an exhaustive list. Advice from qualified professionals is essential in assessing the expected significance and duration of COVID-19 impacts and related government measures on the business unit, and when evaluating how quickly that business unit is expected to recover. A short-term reduction in cash flows followed by a rapid return might not be significant enough to be considered an indicator of impairment for some entities. For others, even a relatively short disruption due to COVID-19 may affect recoverability of carrying amounts of certain assets. An impairment loss might not be reversed if the fair value of the asset or group of assets subsequently increases in a future period. (3)
- Under GAAP there is the use of a “triggering event” for restatement purposes. From a financial reporting perspective, the fair value of assets could come under pressure as the economic impact becomes more visible. Impairment testing is required whether in the case of a “triggering event”, as defined in ASC 350 – Intangibles –Goodwill and Other, and in ASC 360 – Plant, Property and Equipment. Triggering event-based impairment testing is an issue even for those who have made accounting elections whereby assets are being amortized rather than tested annually for impairment. (4)
As professional appraisers we are being asked to assist in the quantification of impairment for facilities all over the world. The American Society of Appraisers has offered previous guidance to allocating impairment losses to the value of assets.
If value in use for a single cash generating unit (CGU) is less than the sum of Depreciated Replacement Cost (based on physical and functional depreciation) of the assets comprising the CGU and the difference is recognized as asset impairment (economic obsolescence), the question then arises as to how to allocate these impairment losses among the assets comprising the CGU. IFRS does not include a directive concerning how impairment losses are to be allocated; it is an accounting policy decision taken by a company in consultation with its auditors working with the appraisers. Two opinions are prevalent: (1) losses can be allocated according to the relative value of each asset based on the sum of DRC value for all assets in the CGU: e.g. a single asset representing 15% of total DRC asset value would be allocated 15% of the total impairment loss, or (2) Identify the assets that are the main cause of the economic obsolescence and allocate losses mostly to those assets: e.g. if a certain piece of equipment has a capacity to operate at 100 hours per week but is only used 50 hours per week and all other assets are utilized at capacity, then the underutilized asset be allocated most of the loss. (5)
We would urge our clients to continue to confer with their accounting and appraisal counsel on the potential impairment and impact on their financial statements. This could have a cascade effect on your tax and equity positions.
REFERENCES:
2020 PwC.. In Depth. A look at current financial reporting issues
Clare Beckker (2020). COVID-19 and Financial Reporting: 5 Things to Know.
2020 Chartered Professional Accountants of Canada. Financial Reporting Alert, May 2020, Accounting Standards for Private Enterprise (ASPE). ]
2020 Whitley Penn. Triggering Events and Impairment Testing: Financial Reporting Issues in a COVID-19 Environment.
Ludmila Simonova (Unknown). Applying Business Valuation Techniques to Determine Economic Obsolescence of Real Property and Personal Property Assets for the Purpose of Financial Reporting in Europe
In contending with COVID 19 and other events such as the West Coast wildfires, or flooding in the Southeast US, many of our clients are examining their fixed assets to develop strategies to maximize value and mitigate risk. In working with them in examining their fixed assets, we always start with “Intended Use”.
Fixed assets represent a significant portion of an enterprises asset base. Most organizations have reasonable estimates of the values or costs of their fixed assets but there are a variety of reasons why an organization may need an external third party valuation by an accredited firm. In this article, we cover seven of the main Intended Uses for fixed asset valuations.
Insurance Placement
Considering the increasing cost of insurance coverage, it is wise to obtain a Cost Estimate Report (insurance appraisal). This will assist with ensuring the coverage is adequate, and that you are not over insured. Whether an organization is renewing their current insurance policy or seeking a new insurance provider, they must provide an accurate statement of their insurable fixed assets. Although trended historical costs, internal estimates and supplier quotations may seem to be adequate, they often are not. A formal valuation of the organization’s insurable fixed assets is generally recommended every three (3) to five (5) years depending on the amount of construction material and labour cost changes over that period. In the interim years, Suncorp has developed a composite index with which we can provide desktop updates.

Financial Reporting
The need for an accurate statement of fixed asset values in Financial Statements may be driven by a number of circumstances from compliance to accounting standards to business combinations. For example, the Public Sector Accounting Board (PSAB) revised section PS 3150 of the CICA Public Sector Accounting Handbook: “Reporting of Tangible Capital Assets.” As a result, local governments are required to record capital expenditures as capital assets and amortize them over their useful life. The goal of this standard change was to render financial reports that are more current, accurate and comprehensible – hence more useful to legislators, oversight bodies, creditors and the general public. Another change in accounting was when IFRS replaced GAAP for publicly accountable enterprises and government business enterprises. For Property, Plant and Equipment, IAS 16 prescribes accounting treatment for PPE. Relative to business combinations, the recognition and measurement of acquired fixed assets can be challenging. IFRS 3 Business Combinations outlines the accounting when an acquirer obtains control of a business (e.g. an acquisition or merger). Such business combinations are accounted for using the ‘acquisition method’, which generally requires assets acquired and liabilities assumed to be measured at their fair values at the acquisition date.
Asset-Based Financing
Changing economic conditions, uncertain market changes, or shifts in collateral values can cause both lenders and borrowers to reconsider their financial position. In addition, asset-based lending is a key tool for business sustainability and growth when it comes to managing cash and opportunities for expansion. Valuations of the fixed assets are typically required on an Orderly or Forced Liquidation basis depending on the circumstances. Occasionally lenders may accept Fair Market Value-Continued Use as an appropriate premise if an organization’s earnings support the fixed asset valuation.
Asset Control and Management
For organizations both large and small, there is a need to monitor fixed assets in terms of their age, condition and expected dates of replacement. A formal inspection and inventory are typically part of fixed asset valuations. The detailed information provided in valuations can be used to assist internal staff with the development of a formal asset management plan or the need to hire additional consultants to complete formal condition assessment or other studies.

Multi-Use Valuations
Although each of the intended uses above were discussed independently, it is often more cost-effective to complete fixed valuations for multiple uses at the same time. This is because many of the same tasks such as inspections and inventories need to be completed regardless of the reason for the report. Additionally, values that are developed for one purpose (i.e. Reproduction Cost for insurance purposes) may be required to develop values for other purposes (i.e. Fair Market Value for purchase price allocation).
In conclusion, given the wide variety of uses it is important in requesting a fixed asset valuation to clearly communicate what the intended use of the valuation is and to also advise if there are any secondary purposes that may be able to be incorporated into the valuation service provided. This will ensure that you receive the correct valuation for your use and users.
Contact Suncorp today for all your valuations needs.
As an essential service supporting insurance, finance, accounting and litigation we have continued to work with our clients to mitigate the risk of COVID 19 for our appraisal and risk management teams in conducting inspections. Ergo, we have been able to advance appraisal and risk management engagements so our client’s applications for insurance, financing, or other purposes can proceed without delay.
As we have been planning our engagements, we are contending with travel restrictions which have forced us to look at travel routes and strategic use of our staffing. As we did this, we started at looking at all the countries we have been pleased to work in the last few years. As the map below depicts, we truly have a global reach and this continues today as we plan current assignments in countries such as Lithuania, Poland, Indonesia, Brazil, Mexico, Australia and all over North America.
Thanks to you, our valued clients, we have been pleased to expand our North American network of offices, while bringing on appraisers based in Europe and South America to better serve your needs. At this time we wanted to thank you for the continued trust in our services and appreciate your patience as we develop processes (such as conducting inspections at maintenance shutdowns or off peak hours) to keep your organization’s and our appraisal teams safe!
As we are deemed an essential service in supporting the banking and insurance sectors, we are still progressing with the completion of appraisals and risk management reporting. We have had to alter our inspection protocols to ensure the safety of our clients and staff, inclusive of having all of our appraisal/risk management staff working remotely. One of the questions that our clients have been asking is our thoughts on values post COVID.
There are so many factors in that single question, here are some of the factors we will be examining post COVID:
• Cost of money, with prime interest rates in North America being nearly zero, will banking institutions lower their lending rates, thereby increasing “cheap” capital for investment and recovery activity;
• How long will “cheap” capital be available, if the recovery period is accelerated, cost of funds may go up;
• What types of government stimulus programs will there be, which, in turn, will affect construction activity and potentially impact the cost of construction;
• Changes in demand, will remote working and the prolonged need for physical distancing change the demand for real estate which would impact market values and potentially insurable values;
• Will we continue to focus on climate change initiatives that mean more “Green” buildings, will the potential changes in demand and the drive for innovation make these buildings more affordable;
• Will oil prices and demand continue to sag, which in turn can affect the demand and values of “yellow iron” and other machinery?
In looking at these factors, we will look to examine other Black Swan events. Since 1997, we can look at 9 such events (1):
1997 – Asian Financial Crisis
2000 – The Dot-Com Crash
2001 – 9/11
2008 – Global Financial Meltdown
2009 – European Sovereign Debt Crisis
2011 – Fukushima Nuclear Disaster
2014 – Crude Oil Crisis
2015 – Black Monday China
2016 – Brexit
The current economic malaise is due to a non-economic event such as 9/11, the 2008 Global Financial Meltdown was due an economic event (bad credit, high debt loads). However, events like the 2008 Global Financial Meltdown provide us context for a recovery period. Running up to 2008 we saw a “complacency that emanated from years of stable growth, low inflation & high employment rates in the US which brought financiers to lend recklessly”. (1)
In 2020, we had a similar scenario, stability of growth, lower inflation and high rates of employment in the United States. We were seeing the impact in our appraisals as best illustrated by the following graphs:
Relative to insurable cost values on a generic basis:
Relative to market values for commercial real estate on a generic basis:
Green Street Commercial Property Price Index
Indexed to 100 in August 2007
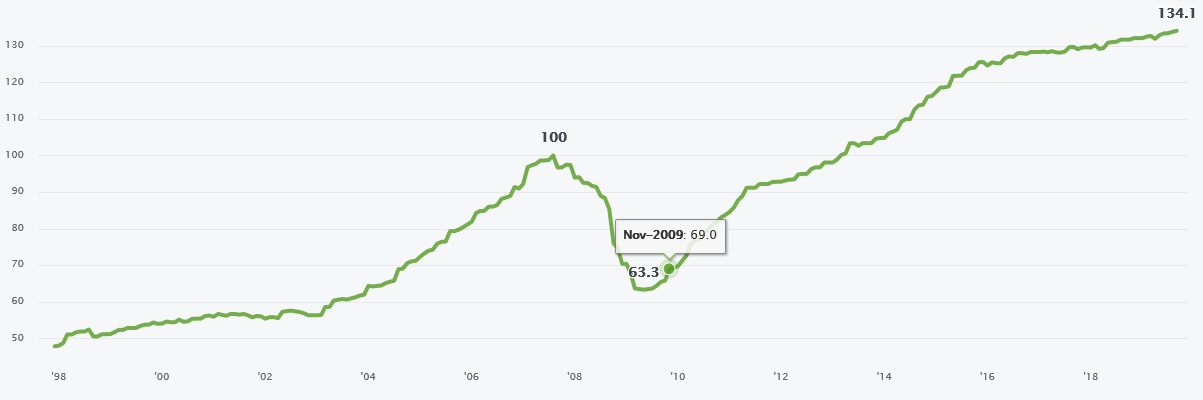
All Property CPPI weights: retail (20%), office (17.5%), apartment (15%), health care (15%), industrial (10%), lodging (7.5%), net lease (5%), self storage (5%), manufactured home park (2.5%), and student housing (2.5%). Retail is mall (50%) and strip retail (50%). Core Sector CPPI weights: apartment (25%), industrial (25%), office (25%), and retail (25%). (2)
So what does this all mean for impact on values? It is important to note the distinction between insurable cost values and market values (we have posted to our web-site a previous blog on the distinctions between these two premies of value).
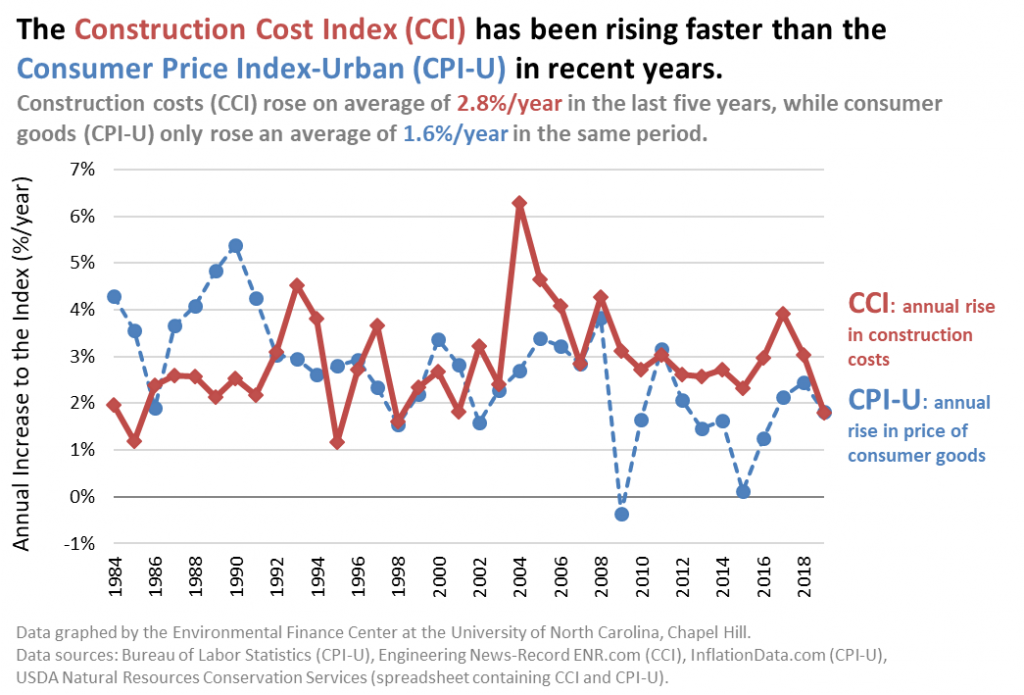
Prior to COVID 19 and the oil price crisis, we would look at some predictive models (as below from Science Direct) that provided trends for construction costs (3):
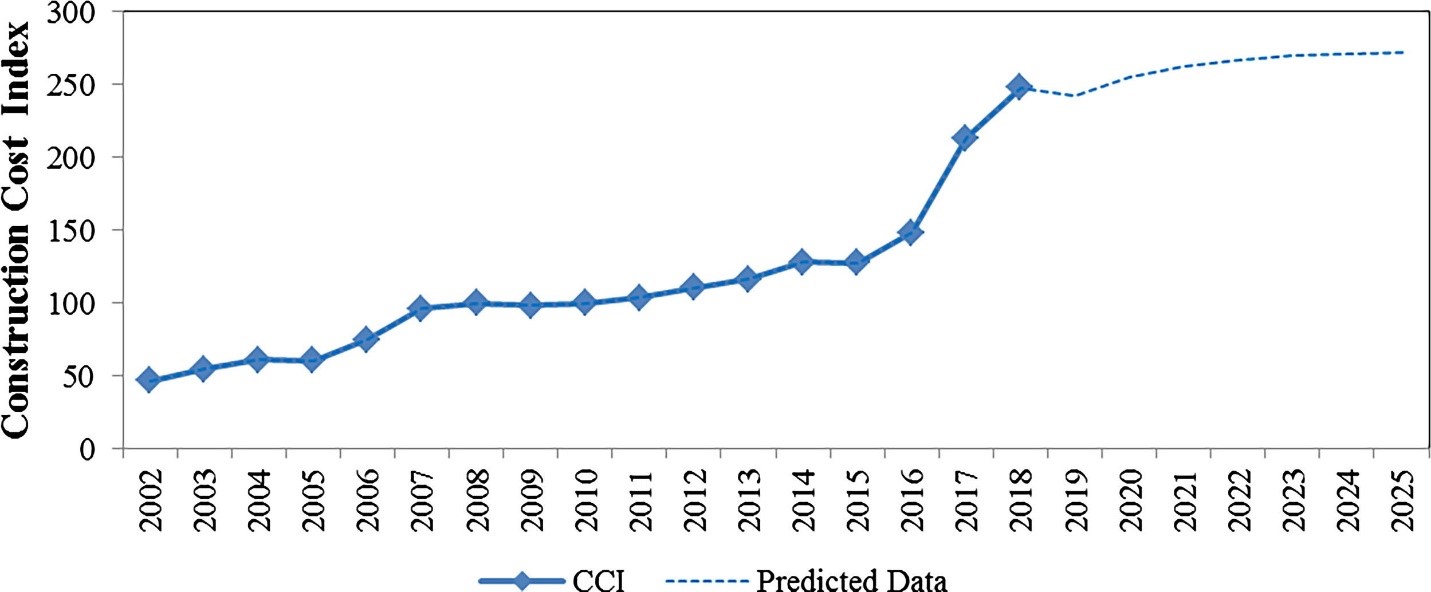
However given the unprecedented nature of the current Black Swan event no one can reasonably predict what the new trends will be, perhaps we will see no change, an increase or sharp drop for both construction costs and market values. However, government intervention may stave off sharp drops or at least shorten the effects of the Black Swan event. Again it is important to note the distinction between insurable cost values and market values, the trends for both are somewhat correlated over time (not perfectly), however in the current environment they could de-couple as governments look to financially support infrastructure projects as economy starters. Furthermore, we could see future insurable cost values and market value trends differ for component type, property type and regions.
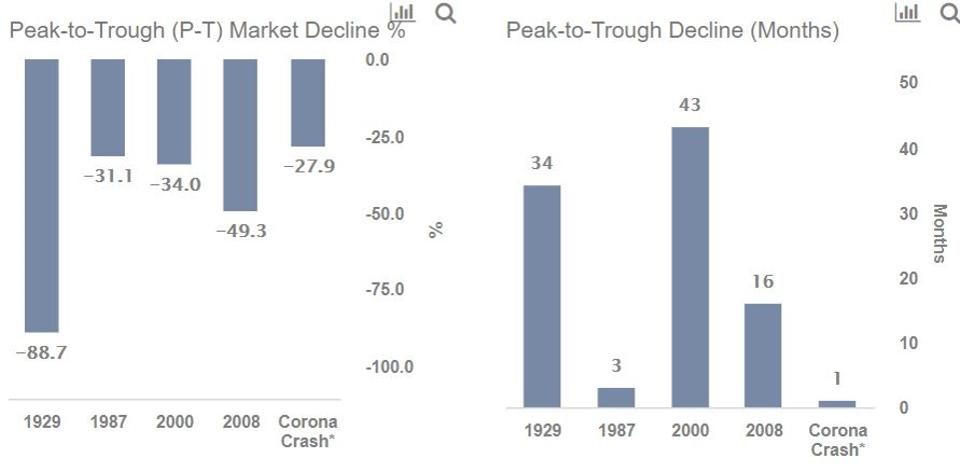
Ultimately, we know we are in for periods of volatility (and that the volatility maybe based on geography), particularly until we have a vaccine for COVID 19. Accordingly, the only impact we can predict with some certainty is that we are going to have some volatility, and that we will need to build in some contingencies for this event and for future Black Swan events, time tells us they will occur and this latest event takes us to the extreme in terms of magnitude of impact. As below, some timelines that demonstrate potential impact due to COVID 19.
Timelines of Past Crises in the Stock Markets (4):
| Crisis |
Pre-Crisis Peak |
Market Bottom |
| Great Depression |
August 1929 |
June 1932 |
| Black Monday |
August 1987 |
November 1987 |
| 2000’s Recession |
December 1999 |
September 2002 |
| Great Recession |
October 2007 |
February 2009 |
REFERENCES:
Faisal Khan (January 18, 2019). 9 Black Swan Events that changed the Financial World. Retrieved from https://www.datadriveninvestor.com/2019/01/18/9-black-swan-events-that-changed-the-financial-world/
Commercial Property Index. Retrieved from https://www.greenstreetadvisors.com/insights/CPPI.
Construction cost index prediction using neural networks. Retrieved from https://www.sciencedirect.com/science/article/pii/S1110016819300316#f0025
Trefis Team (March 13, 2020). Market Crashes Compared:-28% Coronavirus Crash Vs. 3 Historic Market Crashes. Retrieved from https://www.forbes.com/sites/greatspeculations/2020/03/13/market-crashes-compared28-coronavirus-crash-vs-4-historic-market-crashes/#5112cdd14ee8